Friday, August 26, 2011

GViz Framework Architecture


GViz core is the main component in GViz which initializes the functionalities of the Framework. Since Data Providers are allowed to have asynchrony behavior to load data from servers GViz uses Event Driven Architecture (EDA) to optimize the browser performance. To use EDA GViz Events were implemented within the core using JavaScript (Since JavaScript doesn’t natively support Non-DOM events).
Core module provides the flexibility to plugin new Visualization Components for Data Visualization through configuration on the webpage. 

GViz Data Providers

In GViz Framework V2.0 both DSPL & Data can be input to the Framework using same Providers. Only requirement is for the data to be in correct format related to the provider. New provider specification is shown in the following Figure.

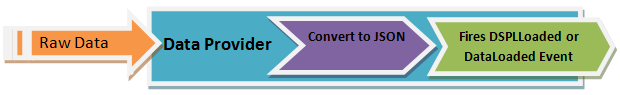
Gviz Data Provider Specification


For Data Providers gviz.convert namespace contains utility methods to convert between different data formats. GViz core only handles JSON data therefore Data Providers should convert the raw data format to JSON before providing to the GViz core.
The converted data should be in following JSON format in order for the GViz Core to operate.
   {
       rows: [{c:[{v: 'Work'}, {v: 11}]},
              {c:[{v: 'Eat'}, {v: 2}]},
              {c:[{v: 'Commute'}, {v: 2}]},
              {c:[{v: 'Watch TV'}, {v:2}]},
              {c:[{v: 'Sleep'}, {v:7}]}
             ]
     }
Few examples of a GViz Data Providers are shown below.


gviz.dataprovider.jsonstr

gviz.dataprovider.xml


Sunday, August 21, 2011

Introduction to GViz Framework


Geo data visualization is one of the major areas affected by the rapid technology growth of modern browsers as well as client side scripting languages. It enables to develop standalone as well as distributed applications which enables to visualize large amount of geodata in informative manner.


GViz Framework is a geo data visualization framework which basically built using JavaScript and freely available visualization API's & Libraries.


It supports data source integration through data providers (e.g: Google Doc, CSV File, XML File,JSON File, XML String, JSON String, CSV String etc.) implemented in the framework and it provides extendable & simple API to write custom data providers.

The data is described using Data Set Publishing Language (DSPL) which uses a XML Schema. The Framework uses both the regular DSPL Schema with JavaScript configuration and Extended DSPL Schema to support direct configuration of Data Providers & Visualization Components (Vizcomps).To visualize data GViz utilizes existing visualization components(e.g Maps, Charts , Graphs etc.) as well as keeping the flexibility through API to add new custom components.


Few of the features of GViz is categorized as below,
  • Rich set of popular components
  • Configurable visualization
  • Facilitate data binding to sources
  • Easy integration
  • Independent from server side technology

Using GViz Framework consists of following 3 steps,
  • Prepare DSPL document
  • Add GViz to the webpage
  • Configure Providers  & VizComps

That's all you need to build a exiting web dashboard or a webpage with rich set of visualization components connecting with different data sources.


You can find GViz Framework Source Code At: Google Code - GViz Framework. More information of using GViz framework will be added to the next blog post.